
How much have prices actually increased? Armenia and the world from 2018 to 2026
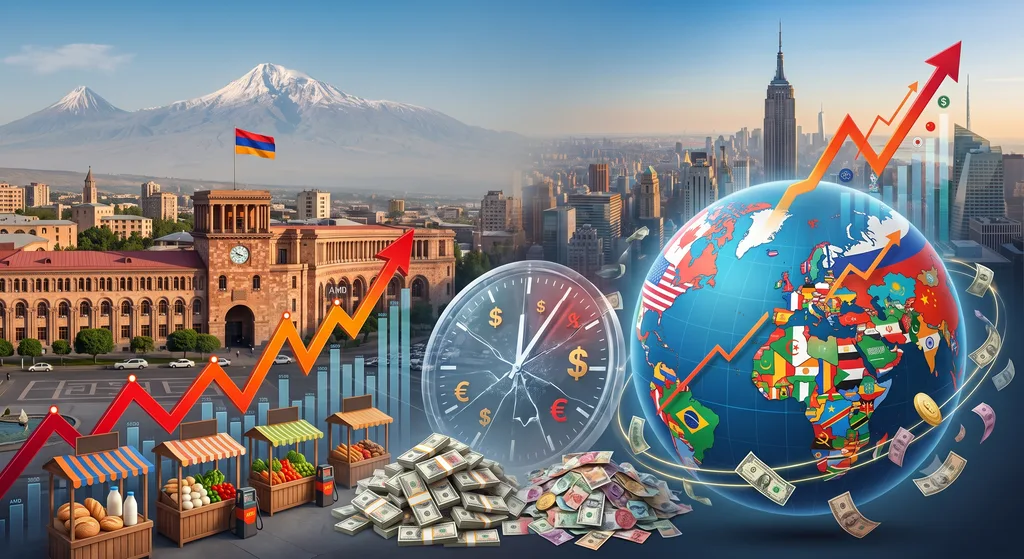
To the question of how much prices have risen over the last eight years, almost everyone answers in roughly the same way: "a lot."
But when you look at the official figures, an unexpected picture emerges. Cumulative price growth in Armenia since 2018 is lower than the global average and is almost the same as in the European Union and the US.
In this article, we try to understand why the picture of numbers differs so much from the subjective feeling.
Official figures: year by year
Below are the annual growth rates of consumer prices according to the harmonized data of the IMF, the World Bank, and the OECD. These sources deliberately use a unified methodology to make countries comparable.
| Year | Armenia | EU average | USA | World |
|---|---|---|---|---|
| 2018 | 1.73% | 1.70% | 1.92% | 3.62% |
| 2019 | 0.93% | 1.56% | 2.10% | 3.90% |
| 2020 | 3.86% | 0.16% | 1.56% | 3.00% |
| 2021 | 7.92% | 5.35% | 7.39% | 6.31% |
| 2022 | 8.35% | 10.76% | 6.41% | 8.89% |
| 2023 | −0.65% | 3.22% | 3.24% | 6.15% |
| 2024 | 1.68% | 2.66% | 2.73% | 4.87% |
| 2025 | 3.15% | 2.18% | 2.65% | 4.01% |
The cumulative result
When the interest rates of these eight years are multiplied by each other, the following is obtained:
| Price growth 2018–2025 | |
|---|---|
| Armenia | +29.9% |
| EU average | +30.7% |
| USA | +31.5% |
| World (medium) | +48.6% |
The cumulative indicators are calculated based on the official annual percentages of the table above.
In other words, a basket of goods worth 10,000 drams at the end of 2017 cost about 13,000 drams at the end of 2025.
On a global average, the same basket has risen in price by almost 50 percent.
And in 2026
The year 2026 is not yet over, so it is not included in the cumulative indicator. But the current data is as follows:
- February 2026 — annual inflation at 4.3%, the highest since May 2025
- June 2026 — 5.1%
- July 2026 — 4.5% (a 1.4% deflation was recorded compared to June)
In other words, in 2026, inflation in Armenia accelerated, remaining above the Central Bank's 3 percent target.
Why is the feeling different?
Here are the three reasons that explain the discrepancy.
1. The average hides food prices
Overall inflation includes clothing, household appliances, communication, and other categories where prices often even decrease.
But a significant part of the family budget is food. And there, the picture is different.
In February 2026, when overall inflation was 4.3%, the prices of food and non-alcoholic beverages had increased by 6.5% year-on-year, those of alcoholic beverages and tobacco by 10.3%, and those of education services by 8.3%.
In October 2025, overall inflation was 3.7%, while food inflation was 5.6%.
In other words, food is consistently getting more expensive faster than the overall rate. And a person buys bread and milk every day, not a refrigerator.
2. The jumps in individual products are much larger
According to July 2026 data, compared to the same month of the previous year:
| Product | Change |
|---|---|
| Gasoline | +7.4% |
| Diesel fuel | +14.3% |
| Liquid hydrocarbons (butane, propane) | +44.6% |
When a person sees a 44% price increase at a gas station, they don't think "overall inflation is 4.5%".
3. Global food prices are approaching a new record
This factor comes from outside and does not depend on Armenia.
The Food and Agriculture Organization (FAO) food price index:
- 2021 average — 125.7 points
- March 2022 peak — 160.2 points (all-time high)
- 2025 average — 127.2 points, which is 27.2% higher than the 2014–2016 base period
- July 2026 — point 131.1
The July figure is the highest in more than three years, although it is still 18.2% below the March 2022 peak.
In separate product groups:
- Vegetable oil index: 195.7 points, the highest since June 2022
- Global wheat prices rose by 5.8% in July, and by 9.9% year-on-year.
- The dairy index, on the contrary, fell by 25% on an annual basis.
FAO Chief Economist Maximo Torero told Reuters that the wars in Iran and Ukraine, combined with the impact of El Niño, are creating a combination of high costs and low yields, and that food prices will continue to accelerate at the end of the year and in 2027.
The most important question: what happened to the income?
Inflation itself is a meaningless indicator unless compared to income. This is where the picture becomes complicated.
Official average
In 2025, the average monthly nominal wage in Armenia was 303,140 drams, 5.6% higher than in 2024. In May 2026, the figure was 319,562 drams.
But the average is misleading
The March 2026 study by the “Tvyal” analytical platform (authored by Aghasi Tavadyan), which is based on Armstat's grouped data, shows three completely different numbers.
| Indicator | The amount | What does it mean |
|---|---|---|
| Arithmetic mean | 293,309 drams | This number appears in official statements. |
| Median (the average person's rent) | 219,736 drams | Half of the employees receive more, half receive less. |
| Mode (most common rent) | 123,326 drams | The most common payroll contract in the system |
The most common salary is only 42 percent of the official average.
The gap is widening
At the beginning of 2018, the arithmetic mean was about 35,000 drams higher than the median. In January 2026, this gap doubled, reaching about 73,500 drams—33 percent of the mean. This is the widest gap recorded in the data series.
According to the analysis, the divergence has sharply accelerated since 2022 due to the influx of capital and highly paid workers into Armenia as a result of Russian sanctions. The arithmetic mean absorbed this influx, while the median moved much more slowly.
Real purchasing power
According to "Tvyal"'s estimates, the nominal wage of the average person has almost doubled since 2018. Since the cumulative growth of prices in the same period was about 30 percent, real purchasing power has increased.
However, the analysis highlights that after adjusting for inflation, the profit is significantly smaller than the nominal figure and is highly concentrated in the upper tier.

Why was inflation in Armenia lower than expected
There are two main reasons.
First, the exchange rate of the dram. In mid-August 2025, the US dollar was worth 383.43 drams. In early August 2026, it was about 365.78 drams. That is, in one year, the dollar fell against the dram by 4.6 percent.
Since almost all commodities—oil, wheat, metals—are priced in dollars on international markets, the appreciation of the dram mitigates imported inflation.
Second, fixed energy contracts. The International Monetary Fund's April 2026 report notes that long-term, fixed-price natural gas contracts provide a partial buffer against energy price shocks, and Armenia is cited as an example.
Both of these factors, however, are variable. The strengthening of the dram can reverse, while the gas contract is valid until a certain date.

What the numbers do not show
To be fair, a few limitations.
First: All data refers to the formal sector—about 700,000 employees with registered employment contracts. Informal employment is not included in this picture.
Second: The consumer basket is averaged. In the budget of a low-income family, the share of food is much larger, therefore the actual inflation for them is higher than the official one.
Third: Regional differences are huge. In Yerevan and rural communities, both incomes and the structure of expenditures are different.
Summary
Three conclusions that together make up the complete picture.
First: Cumulative price growth in Armenia in 2018–2025 was about 30 percent, practically the same as in the EU and the US, and significantly lower than the global average of 48.6 percent.
Second: This relatively favorable indicator is largely due to the appreciation of the dram and fixed-price energy contracts—two factors that are not guaranteed in the future.
Third. Average numbers hide polarization. When the most common salary makes up 42 percent of the official average, the "average Armenian" is a statistical character, not a real person.
It is precisely this third point that explains why official figures and everyday perception differ so much.
Sources
- World Bank, IMF and OECD, harmonized consumer price index data (doi:10.1787/eee82e6e-en), summarized by Worlddata.info — https://www.worlddata.info/asia/armenia/inflation-rates.php
- Statistical Committee of the Republic of Armenia — https://armstat.am/am/
- Data of the RA Statistical Committee on fuel prices, ARKA, 05.08.2026 — https://arka.am/en/news/economy/gasoline-prices-in-armenia-rose-by-7-4-in-july-and-diesel-fuel-by-14-3/
- Trading Economics, based on the data of the Statistical Committee of the Republic of Armenia — https://tradingeconomics.com/armenia/inflation-cpi
- FAO: Food Price Index, 07.08.2026 — https://www.fao.org/newsroom/detail/fao-food-price-index-edges-up-amid-weather--energy-and-geopolitical-concerns/en
- FAO: Official page of the Food Price Index — https://www.fao.org/worldfoodsituation/foodpricesindex/en/
- Aghasi Tavadyan, “Beyond the Average: The Real Distribution of Salaries in Armenia”, Tvyal, 27.03.2026 — https://tvyal.com/analysis/en/2026/2026-03-27/
- CEIC: based on the data of the Statistical Committee of the Republic of Armenia, average monthly nominal wage — https://www.ceicdata.com/en/armenia/average-monthly-real-and-nominal-wages/average-monthly-nominal-wage
- IMF, Middle East and Central Asia Regional Economic Outlook, 04.2026 — https://www.imf.org/-/media/files/publications/reo/mcd-cca/2026/english/text.pdf



💬CommentsClick to read and leave a comment⌄
No comments yet. Be the first!